Dr. David Himbara : “Rwanda Has Outdone Itself In Producing Bogus Statistics On Foreign Direct Investment”

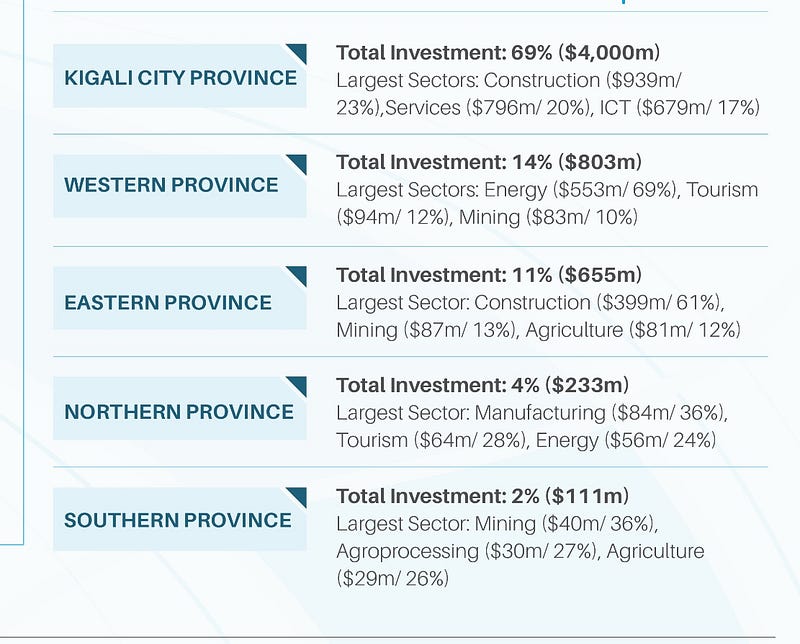
Rwanda’s latest statistics on foreign direct investment (FDI) are embarrassingly fraudulent. As always, the goal is to impress the world on how Rwanda is a successful model of development. The first false claim is that in the last five years, Rwanda received US$5.8 billion. As shown in Table 1, Kigali City is said to have taken the lion’s share of the US$5.8 billion investments. Kigali City Province’s share was US$4 billion or 69% ”in total investment.”
Table 1: Foreign Investment flows into Rwanda by provinces, 2013 — 2017

Western Province received US$803 million or 14% ”in total investment”. Eastern Province received US$655 million or 11% ”in total investment. Northern Province’s share was US$233 million or 4%. Southern Province with US$111 million or 2% in ”total investment.”
The second bogus claim is that in 2017 alone, Rwanda attracted US$1.2 billion. As shown in Table 2, Europe was purportedly the largest source of FDI in Rwanda with US$713.4 million, followed by Asia with US$186.7 million.
Table 2: Sources of foreign investment flows into by regions, 2017

The third largest source of FDI to Rwanda was Africa with US$100.8 million, followed by the Middle East with US$82.4 million and lastly, North America at US$44.5 million.
Rwanda’s data on foreign investment is bogus
Rwanda’s claims of foreign investment of US$5.8 billion in the past five years and US$1.2 billion in 2017 are bogus. The World Bank started gathering data on FDI to Rwanda as far back as 1970 up to 2017 as shown in Table 3. FDI to Rwanda from 1970 to 2017 was US$2.5 billion. In other words, it took 47 years to accumulate the total of US$2.5 billion in FDI. The National Bank of Rwanda (BNR) puts FDI stock in Rwanda even lower than the World Bank.According to BNR, the total stock of FDI in Rwanda is US$1.6 billion. United Nations Conference on Trade and Development (UNCTAD) puts FDI total stock in Rwanda at US$1.7 billion.
Table 3: Foreign direct investment to Rwanda, 1970–2017
1970 — US$60,000
1971 — US$1,700,000
1972 — US$500,000
1973 — US$2,000,000
1974 — US$2,200,000
1975 — US$3,000,000
1976 — US$5,607,533
1977 — US$4,794,908
1978 — US$4,860,992
1979 — US$13,461,650
1980 — US$17,707,777
1981 — US$19,205,990
1982 — US$20,653,349
1983 — US$10,916,401
1984 — US$15,064,915
1985 — US$14,618,053
1986 — US$17,593,148
1987 — US$17,593,613
1988 — US$21,047,058
1989 — US$15,508,619
1990 — US$7,562,353
1991 — US$4,577,984
1992 — US$2,187,569
1993 — US$5,851,479
1994 — US$1,000
1995 — US$2,212,201
1996 — US$2,218,241
1997 — US$2,598,560
1998 — US$7,089,193
1999 — US$1,725,716
2000 — US$8,319,040
2001 — US$4,634,137
2002 — US$2,610,000
2003 — US$4,700,000
2004 — US$7,700,000
2005 — US$10,500,000
2006 — US$30,643,966
2007 — US$82,283,165
2008 — US$103,346,051
2009 — US$118,670,000
2010 — US$250,504,802
2011 — US$119,105,385
2012 — US$254,963,244
2013 — US$257,642,420
2014 — US$314,742,419
2015 — US$223,334,652
2016 — US$266,300,000
2017 — US$293,413,074
In conclusion
Fabricating statistics in Rwanda is not new. As shown here using the case of FDI statistics, be wary. Rwanda’s statistics are generally cooked. In this particular case, however, the country has outdone itself in producing the most fraudulent numbers yet.


